For many areas in the UK, knife crime remains an unfortunate reality. From street gangs to schoolchildren, many individuals carry and are prepared to use sharp instruments as weapons, which has led to an epidemic of violence across the country. Over the last ten years, figures have crept upwards by a shocking 81%, and despite renewed efforts by the police, the number of attacks with knives and sharp weapons only continues to climb.
It is of particular concern when considering the prevalence of knives in our schools. Educational establishments, where children should be able to learn and develop in peace, are too often the scene of attacks or robberies, while the threat of hidden knives in bags or coats ensures staff and children cannot feel truly safe.
According to the Ben Kinsella Trust, 78 under-25s were killed by a knife in the past year, with ten of those victims being under 16 years of age, which has naturally raised alarming questions about knifes in schools. To view our full breakdown of knife crime in schools, see our article here.
Regardless, in Churchill’s latest crime report, we’ll look at the worst knife crime hotspots across England and Wales. We’ll present a general overview first, before ranking the 25 worst regions for knife crime across the country. Finally, we’ll discuss the recent changes – both rising and falling figures – to keep you in the loop of emerging trends.

Across England and Wales, 48,716 knife crimes were reported over the last year, which breaks down to 7.9 offences per 10,000 people. This makes knife offences a less common occurrence than many other crimes, but due to their more serious nature, local communities will often feel more affected from the heightened danger and fear that knife crime can bring to the area.
Unsurprisingly, the majority of knife crimes are related to Assault and Robbery, responsible for 44.8% and 41.3% of knife crimes respectively. Threats with a knife are also common, coming in at 11.3% of all reported knife offences. The most serious instances of crime, including Sexual Assault, Homicide, and Attempted Murder are less common, totalling 2.6% of all knife offences.
What all knife crimes share, however, is a dire threat to life. Whether it’s someone being robbed on the street at knifepoint, or a sharp object being used in a drunken brawl, each and every knife incident has the possibility of lives being lost. This often results in families and communities being torn apart, the perpetrator receiving a lengthy jail sentence, and trust being diminished in local institutions like schools and the police.
A knife offence is no petty crime, and with devastating consequences for those involved, it’s a category of crime that should be treated with the utmost seriousness.
The following areas have some of the worst rates of knife crime in the country, undoubtedly causing concern for local residents and police alike.
With a beautiful natural coastline that stretches from North to East, Norfolk is home to the Broads National Park, which encompasses a range of interconnected rivers and lakes. Despite the area’s natural beauty, it suffers from a knife crime rate of 5.6 per 10,000 people, totalling 522 individual knife offences. This is an increase of a shocking 16% from the previous year.
The West Merica police cover a region that includes Shropshire, Herefordshire, and Worcestershire, making it one of the larger police forces in the country. The force reported a knife crime rate of 5.6 per 10,000 people in the last year, which had fallen by 12% since the previous year to a total count of 672 knife offences.
A county dominated by the town of Cambridge and the world-renowned university within, Cambridgeshire suffers from an overall knife crime rate of 6.1 per 10,000 citizens. The total count of knife offences in the region reached 522 annually, although that is a promising 18% decrease from the previous year, which might prove comforting to those worried about the area’s safety.

Perhaps best known for the White Cliffs of Dover, and the bustling dockside nearby, Kent is an important stop for trade routes between Europe and the capital. Unfortunately, the county reported a knife crime rate of 6.1 per 10,000 people in the last year, with a total count of 1,142 offences. Residents may instead seek comfort in the fact that the rate has fallen 11% in the last year.
Weaving around much of the outskirts of Birmingham and Coventry, Warwickshire is a largely rural area famed for the castle that stands as its centrepiece. The area suffers from a knife crime rate of 6.3 per 10,000 residents, which translates to 383 total incidents. Fortunately, knife crime is on the decline in the county, with a decrease of 9% since the previous year.
Encompassing the historical centre of Winchester and the key port cities of Southampton and Portsmouth, the county of Hampshire is a vital trade hub across the English Channel. With a knife crime rate of 6.5 per 10,000 people, the area saw a total of 1,198 incidents last year, with a decrease of 9% from the previous annum.
As one of the only Welsh provinces on this list, Gwent is a former county that has retained its police force despite splitting into separate counties. Knife crime is a pressing issue, with Gwent suffering a rate of 6.5 knife crimes per 10,000 citizens, much higher than the Welsh average. Particularly concerning is the rapid increase, with a 17% rise adding up to 376 knife incidents just this year.
One of the larger counties in the West Midlands, Staffordshire stretches from its namesake town in the centre to Stoke-on-Trent in the north and Alton Towers to the east. Unfortunately, the area must deal with a knife crime rate of 6.5 per 10,000 people, which totals approximately 746 individual counts. More positive news is that knife crime is falling rapidly, with a 12% decrease in the past year.
From the renowned seaside resort of Blackpool to the historic and educational hub of Lancaster, the county of Lancashire is a diverse one. This prestige is perhaps slightly offset by the area’s knife crime rate of 6.9 per 10,000 residents, which amounts to 1,043 individual counts, up by 4% from the past year.
As the homeland of famed myths and renowned legends, Nottinghamshire is well known for its tales of Robin Hood and the Sheriff of Nottingham. Despite this, the area has drawn a knife crime rate of 7.0 offences per 10,000 residents, and while this does reach a total of 819 counts, recent declines in knife crime have seen incidents fall by 3% in the last year.
From sweeping valleys and rising hills, Derbyshire is home to the vast majority of the Peak District. However, the main population areas, such as Derby and Chesterfield, have attracted substantial knife crime with a rate of 7.3 per 10,000 people. Of deep worry is the sharp rise of incidents, with a 15% increase in knife incidents being among the fastest rising trends in the UK, totalling 768 individual counts.
Comprising of both West and East Sussex, the area’s police force covers historical heavyweights such as Hastings, and major towns like Eastbourne, Worthing, and Chichester. Across these areas, the knife crime rate has risen to 7.3 per 10,000 residents, with a total incident count of 1,030 offences. This represents a significant increase of 8% since the previous year.
An area of undulating rivers and low, rolling hills, Northamptonshire is sparsely populated but still manages to attract a high rate of knife crime at 7.3 per 10,000 people. This adds up to a total of 552 offences, an alarming figure for such a quaint county. However, incidents have fallen by 18% since last year, a sharp decrease which should help put some local minds at ease.
Almost entirely dominated by the cathedral city of Leicester, the surrounding county is heavily rural. The majority of Leicestershire’s knife crime rate of 7.6 per 10,000 citizens will be drawn from the city itself, amounting to a total of 808 offences. Despite this, a recent decrease of 18% in knife crime spells out some more optimistic news for residents.
A former Anglo-Saxon kingdom, the Northumbria of today is a much smaller but no less significant area. Despite being highly rural (encompassing a national park, nature reserve, and parts of Hadrian’s Wall), the area’s knife crime rate comes in at a high 7.8 per 10,000 people. This amounts to 1,135 offences, a sharp increase of 11% from the previous year’s figures.
Responsible for Somerset and its surroundings, the Avon & Somerset police patrol an area including Bristol, Bath, and parts of Gloucestershire. With both renowned festivals and bustling metropolises falling under their coverage, the force has reported a knife crime rate of 8.0 per 10,000 citizens in the last year. That amounts to 1,368 incidents, with a worrying 14% increase from the previous year.
A small county just a short distance from the capital, Bedfordshire stretches from Luton in the south to the county’s namesake in the north. Despite being mostly rural, the area has still garnered a troublesome knife crime rate of 8.0 per 10,000 people. This translates to 545 offences in total, coming off the back of a 6% decrease that may lead to further reductions in the future.

Situated just beyond the outskirts of London, Essex is a staple of the UK’s south. Despite this, it suffers from a problematic knife crime rate of 8.5 per 10,000 people, with an overall count of 1,575 incidents. While this may be concerning, the rate of knife crime is falling across the area, with a 4% annual decrease.
While the city of Liverpool and its outskirts make up most of the county of Merseyside, other important towns include Southport, St. Helens, and Formby. Sadly, the area has developed an unwanted reputation for knife crime, with a shocking rate of 8.8 per 10,000 residents. While the total count runs as high as 1,276 knife incidents, a significant decrease of 14% might help improve the area’s troubles with knife crime.
Covering an area that primarily consists of the East Riding of Yorkshire, Humberside police are responsible for Kingston upon Hull and the River Humber. The area’s knife crime rate has nearly reached double digits, with 9.9 offences per 10,000 citizens. That amounts to a worrying 853 crimes, and with an increase of 1% over the last year, those figures are only set to rise further.
Many of Yorkshire’s major population hubs, such as Leeds, Bradford, Huddersfield, Wakefield, and Halifax, are located in the western portion of the region. Accordingly, the area has a startling high knife crime rate, at 10.0 per 10,000 residents, or 1 crime for every 1000 people. With a total number of 2,373 offences, and a recent rise of 1%, the area is a key problem spot for knife-related incidents.
Another highly urban area, South Yorkshire is home to the towns and cities of Sheffield, Rotherham, and Doncaster. The region has a total knife crime count of 1,629, which correlates to a worryingly high rate of 11.7 offences per 10,000 people. Further compounding this is the unflinching nature of knife crime in the area, which saw a 0% change from the last year.
As the UK’s bustling capital city, London is home to almost 9 million residents, so it’s only natural that the city will be experience a high number of knife-related incidents. The capital’s knife crime rate stands at a startling 15.6 per 10,000 residents, which correlates to an enormous 13,957 individual counts, which is by far and away the largest figure in the country. Unfortunately, that stat has risen by 22% in the past year and is showing little sign of slowing down.
The police force of Cleveland (which now covers parts of North Yorkshire and the county of Durham) deals with an extraordinarily high knife crime rate of 17.0 per 10,000 people. While this adds up to only 920 incidents across the region, this high rate of crime is of great concern, especially when considering that the rate has increased by 10% since the previous year.
Officially the worst hotspot for knife crime in England and Wales, the county of West Midlands consists almost entirely of Birmingham, Coventry, and Wolverhampton, meaning the high population density results in a horrendously high knife crime rate of 17.7 per 10,000 residents. While that may add up to a shocking 5,239 offences annually, that figure has also risen by 5% since the prior year, further increasing concerns for locals.
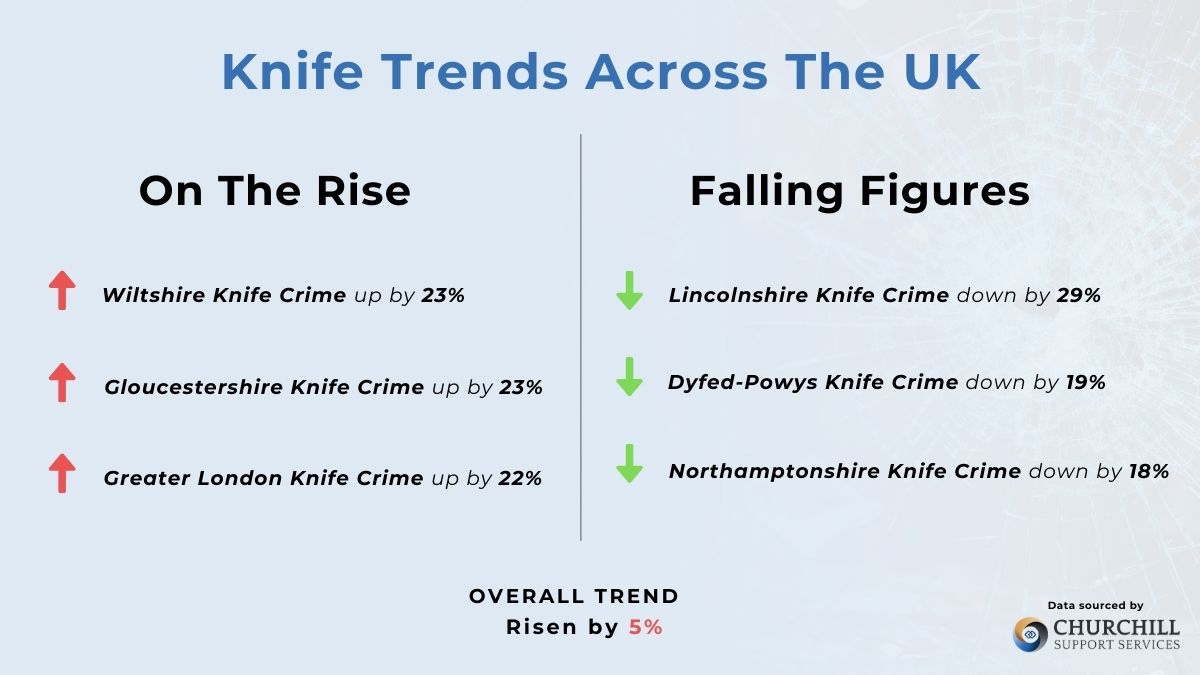
Despite pressure groups emerging to push for an end to knife crime, and a renewed focus by the police to reduce figures in recent years, the overall trend of knife crime has still increased by 5%. While this recent rise isn’t as sharp as some other offences, such as shoplifting (32%) and theft (18%), the current figures mark an unfortunate increase in knife crime rates that are already among the highest in the country’s history. Therefore, it seems clear that the epidemic of knife crime across the nation shows no sign of dissipating anytime soon.
In some locations, knife crime has risen substantially. Wiltshire (23% worse), Gloucestershire (23% worse), County Durham (22% worse) – and, perhaps most worryingly, Greater London (22% worse) – have all seen rises of over one-fifth in knife-related incidents. That should be concerning for local residents, as if those trends continue in the same way, knife crime could more than double in 5 years.
However, there is a light at the end of the tunnel. Some areas have succeeded in bringing knife crime figures down substantially, including Lincolnshire (29% better), Dyfed-Powys (19% better), Northamptonshire (18% better), and Cambridgeshire (18% better). It’s also worth noting that areas are roughly split in terms of those that are worsening and growing better, indicating a rather volatile and changing situation across the country.
To prevent knife crime on your property, taking precautions is of great importance. Utilising a professional security company like Churchill Support Services makes this much easier, with our manned guards able to deter threats and remain vigilant for potential intruders. Contact us today to see how we can safeguard your people, assets, and premises.
With the aim of being transparent and open with how we source our data, Churchill uses information from the Police UK website, in addition to trusted public and independent sources such as the Office for National Statistics (ONS) and The Ben Kinsella Trust. This open-source police data allows us to determine the total number of sharp weapon crimes in select areas, and calculate both the ratio per 10,000 population and the percentage change since the previous year.
For the purposes of this study, we examined data from September 2022 to September 2023, giving us the most accurate view of national knife crime going into the year of 2024. All of our crime statistics are updated regularly with the most recent data available, ensuring the public remain well informed about the state of crime and policing in the country. For crime statistics in different regions and cities of the UK, see our news and insights here.